
Shyam Valsan


As far long back as I can remember, I’ve always been curious about things. My parents still like to reminisce about the old days when I was a little walking, talking questionnaire. As I’ve grown older I’ve tried to cultivate a healthy sense of scepticism, while continuing to nurture the curiosity. I think that for a mind to flourish it needs to hit the right balance between the two. Curiosity without scepticism makes you gullible and scepticism without curiosity makes you cynical.
Mining data to uncover it’s secrets is great fun, and you get a little kick out of inferring information which isn’t apparent to others observing the same dataset. A little over a year ago while traveling for work in Zurich I was introduced to R by a colleague and I was intrigued, after deciding to learn it so I can try to optimize and add features to some of my existing scripts I soon found that what I had at my command was power tools compared to the crude stone tools I had used before. Now, to be clear, I’m no statistician or data scientist or R guru - but that’s the best part about R, it’s so simple to use, with so many powerful packages already available - that you don’t have to be any of those things to have fun with it.
How to make the best use of all the data we have access to, is one of the big problems of our age. Data is all around us, but to clean, transform, wrangle and make it useful is a really hard, time consuming job. But for those who persevere, the payoff could potentially be to fundamentally change the way people think. I personally think that being able to visualize and really understand a data point makes it stick in a persons brain in a way that just hearing or reading something cannot.
I want to use this website to record my experiments with data, using R and other tools. Starting off with simpler visualizations and moving on towards more complex concepts like machine learning and deep learning.
So without further ado, let the experiments begin!
Here’s a teaser to get started, I am not sure where I first saw this pie chart or who first created it (would be great to find out) but it always makes me smile. The R code used here is pretty self explanatory even for R newbies, but if you want to know the details just read help(pie).
pie( c(75,15,5),
c("Sky", "Sunny side of pyramid", "Shady side of pyramid"),
col = c("skyblue","yellow","brown"),
init.angle = -50,
border = NA,
main = "Look, a pyramid!"
)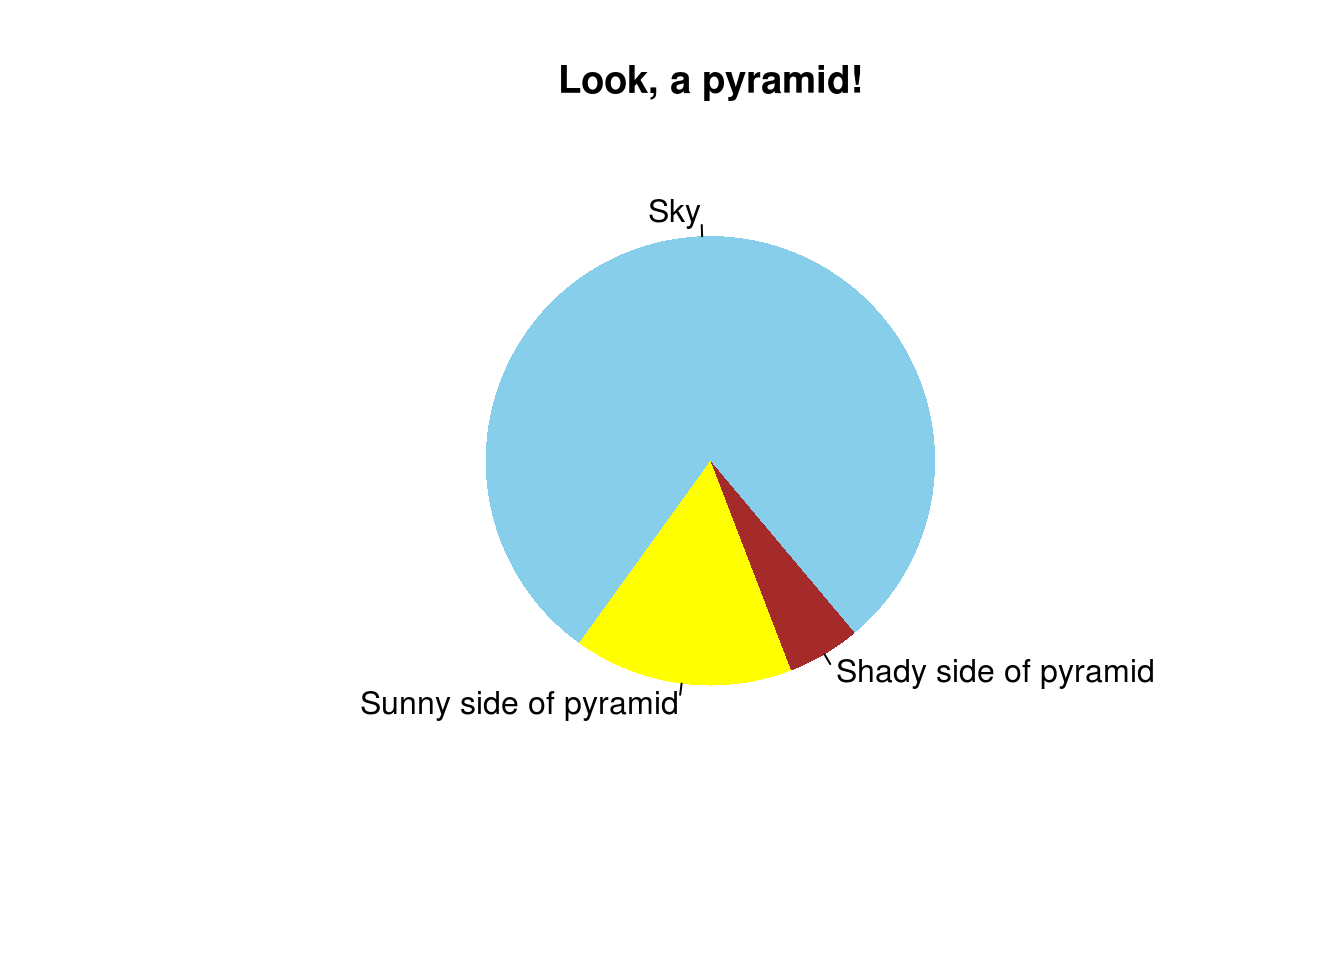 Statutory warning: Pie charts are a very bad way of displaying information. The eye is good at judging linear measures and bad at judging relative areas.